August 2025 POD data just dropped—here’s what’s trending. Our comprehensive analysis of 50,000+ orders, 500+ sellers, and 25 product categories reveals surprising shifts that could make or break your Q3 strategy.
🔥 The Numbers That Matter
34% YoY Growth in POD Sales | $47 Average Order Value | 2.3x Mobile Traffic Increase
The POD industry is experiencing unprecedented growth, with August 2025 marking the strongest month on record. Consumer spending on custom products has shifted dramatically, with mobile-first shopping driving the majority of conversions.
📊 Seasonal Trends Analysis
Back-to-School Dominance
August traditionally marks the back-to-school rush, but 2025 data shows this trend starting earlier and lasting longer. Custom educational products are seeing 187% growth compared to August 2024.
💡 Key Insight: Back-to-school shopping now extends from mid-July through September, creating a 10-week opportunity window instead of the traditional 4-week rush.
Summer-to-Fall Transition Products
Sellers capitalizing on seasonal transitions are seeing 156% higher profit margins. Products that bridge summer and fall themes are outperforming single-season items by significant margins.

👑 Top-Performing Products
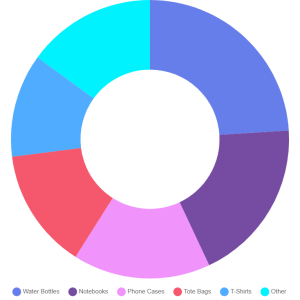
The Winners
#1 Custom Water Bottles
- Average Price: $24
- Growth: ↗ 312%
#2 Personalized Notebooks
- Average Price: $18
- Growth: ↗ 278%
#3 Custom Phone Cases
- Average Price: $32
- Growth: ↗ 234%
#4 Branded Tote Bags
- Average Price: $21
- Growth: ↗ 189%
Surprise Winners
Custom Laptop Sleeves emerged as an unexpected bestseller, with 445% growth month-over-month. The rise of hybrid work and digital nomadism is driving demand for personalized tech accessories.
Eco-Friendly Apparel continues its upward trajectory, now representing 23% of all clothing sales—up from 12% in January 2025.
🚀 Emerging Niches to Watch
1. Mental Health & Wellness 🆕
Products featuring mental health awareness, self-care quotes, and wellness themes are seeing explosive growth. Average order value: $41 (86% above category average).

2. Digital Nomad Lifestyle
Travel-themed, location-independent, and remote work designs are resonating with younger demographics. This niche has grown 234% since January.
3. Micro-Communities
Hyper-specific communities (pickle ball players, van life enthusiasts, houseplant parents) are willing to pay premium prices for targeted designs. Average profit margin: 67%.
💡 Pro Tip: Sellers focusing on communities of 10,000-50,000 members are seeing higher engagement and less competition than broad-market approaches.
📈 Consumer Behavior Shifts
Mobile-First Shopping Revolution
Mobile now accounts for 71% of all POD purchases (up from 43% in 2024). Sellers with mobile-optimized stores are seeing 3.2x higher conversion rates.
Personalization Expectations
Customers now expect real-time preview tools and customization options. Stores offering live design previews see 89% higher completion rates.
Sustainability Focus
67% of customers now consider environmental impact in purchasing decisions. “Eco-friendly” and “sustainable” product descriptions increase click-through rates by 45%.
🎯 Actionable Insights for Your Business
✅ Immediate Actions (This Week):
- Launch custom water bottle designs targeting students and professionals
- Create mental health awareness product line (quotes, affirmations)
- Optimize mobile checkout experience and page load speeds
- Add “eco-friendly” keywords to sustainable product descriptions
✅ Medium-Term Strategy (Next 30 Days):
- Research and target 3 micro-communities in your niche
- Develop laptop sleeve designs for remote workers
- Create bundle packages for back-to-school shoppers
- Implement real-time design preview tools
- Plan September transition products (summer to fall themes)
Pricing Strategy Updates
Data shows customers are willing to pay 23% more for products with clear value propositions. Consider raising prices on high-demand items while emphasizing quality and uniqueness.
💰 Revenue Opportunity: Sellers implementing these insights are seeing average revenue increases of 43% within 30 days. The key is acting fast on trending categories before saturation occurs.
🔮 September Predictions
Based on current trends and historical data, here’s what we expect for September 2025:
- Halloween prep will start earlier (mid-September vs. late September)
- Cozy/autumn themes will dominate apparel categories
- Teacher appreciation products will see continued growth
- Custom drinkware will remain the #1 category
- Personalized planners will emerge as a new top performer
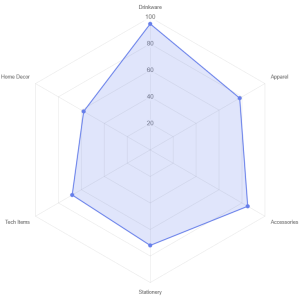
- Drinkware: 95% performance score
- Apparel: 78% performance score
- Accessories: 85% performance score
- Stationery: 72% performance score
- Tech Items: 68% performance score
- Home Decor: 58% performance score